Operational Insights
Operational Insights
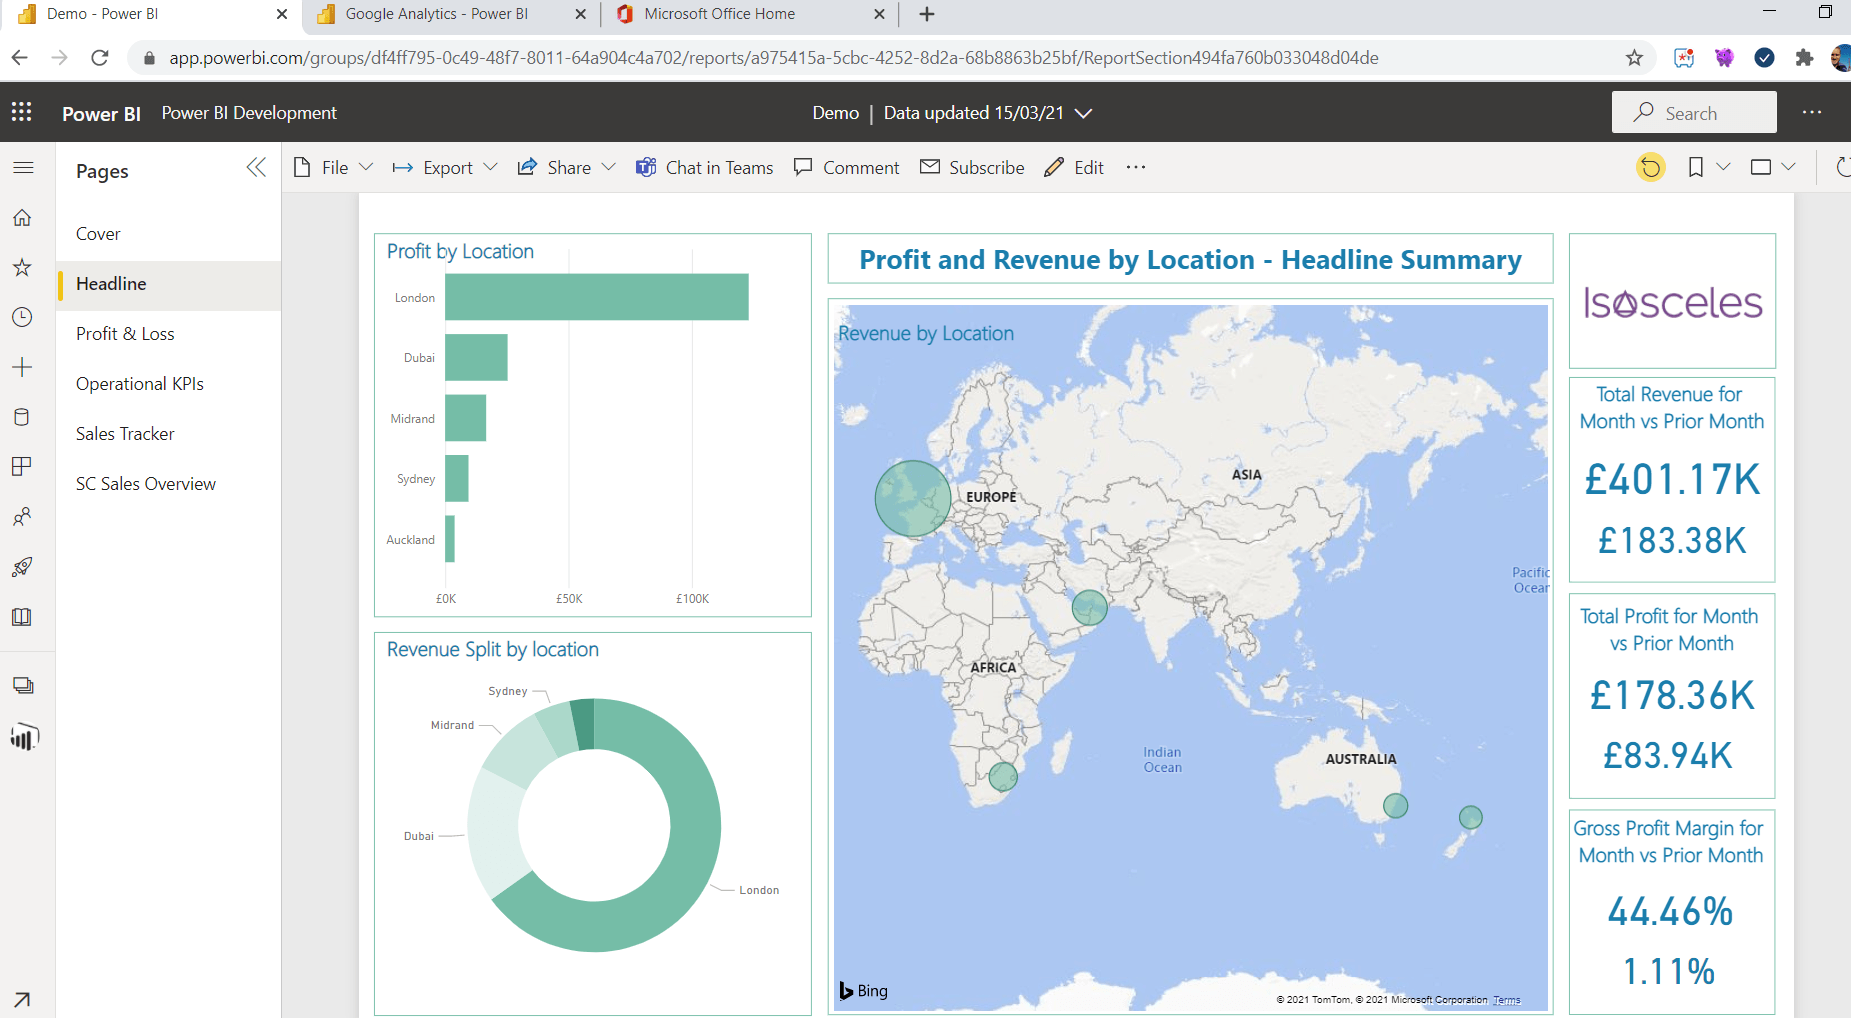
This multi-national client wanted a dashboard that could provide operational insights from their course booking system, as well as the accounting system in each country. The leadership team, who are located in different countries, wanted to understand which courses were profitable and which were not. The dashboard is accessible via the web and provides detail at a graphic summary level as well as detailed numbers.
Watch Video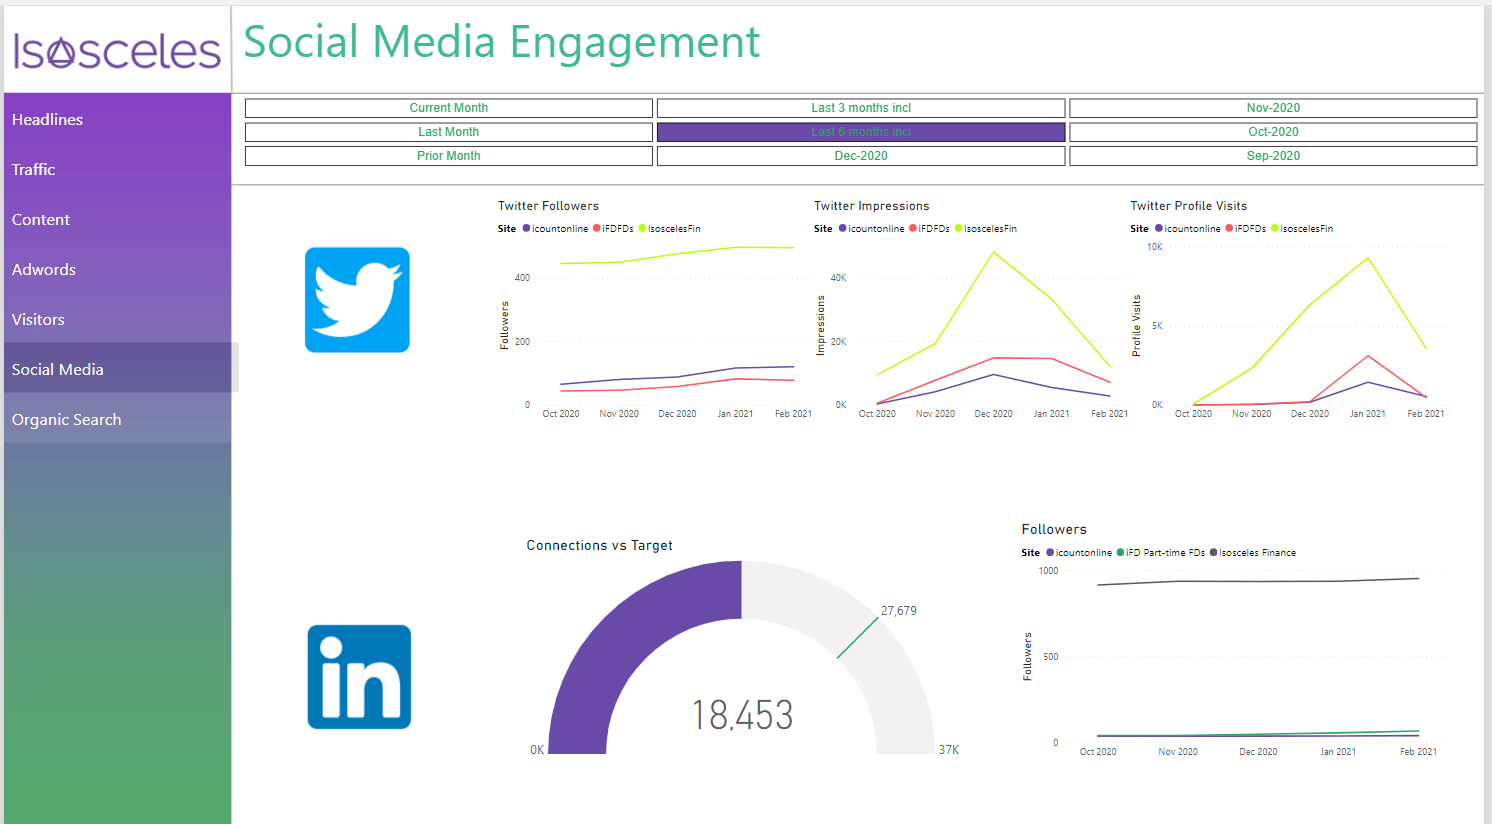
Marketing Insights
Marketing Insights
This client wanted to understand how effective their marketing investment is in terms of driving traffic to their website and generating leads. This dashboard connects Google Analytics, Google AdWords and Google Search Console using Microsoft Power BI so the leadership team can easily view by month or by year how traffic is driven to their website, which activities are creating conversions and the cost of each conversion.
Watch Video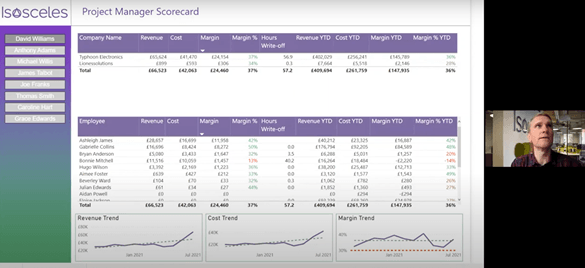
Operational Insights
Managing Consultant Utilisation
An example of how ireport Power BI Consultants can help leaders of consulting organisations manage their people utilisation and profitability by project managers, clients and employees.
This is how we used Power BI to help them do that.
Watch Video
Cash flow
Cash flow forecasting and modelling with Power BI
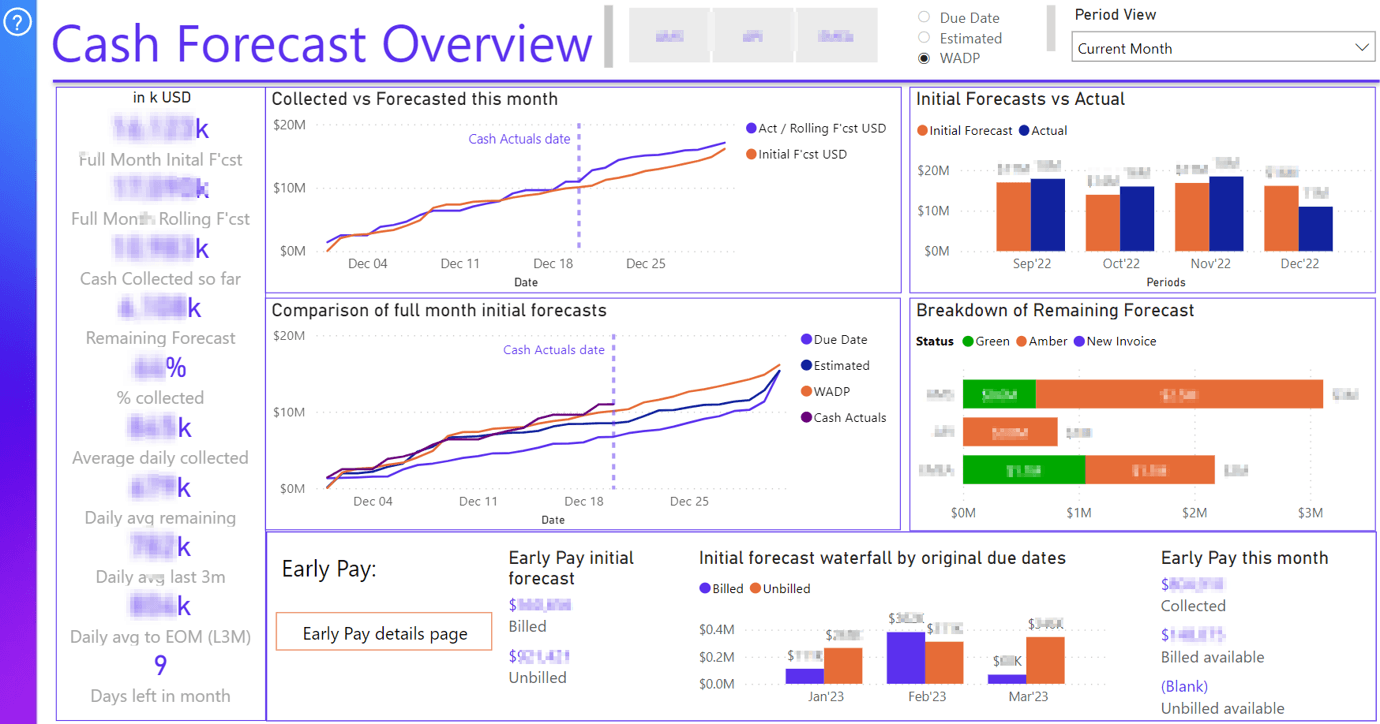
Gaining visibility of a company’s current cash flow position isn’t easy with so many data sources.
At ireport, we helped our clients integrate multiple data sources through PowerBI to not only give them visibility but also enable them to forecast cash flow and model how changes to cash collection can positively impact cash flow.
Watch Video